
| 일 | 월 | 화 | 수 | 목 | 금 | 토 |
|---|---|---|---|---|---|---|
| 1 | ||||||
| 2 | 3 | 4 | 5 | 6 | 7 | 8 |
| 9 | 10 | 11 | 12 | 13 | 14 | 15 |
| 16 | 17 | 18 | 19 | 20 | 21 | 22 |
| 23 | 24 | 25 | 26 | 27 | 28 | 29 |
| 30 |
- 새싹 AI데이터새싹 엔지니어 부트캠프 1일차
- X
- ai 새싹 부트캠프 7일차
- ai 새싹 부트캠프 6일차
- ai 새싹 부트캠프 5일차
- 새싹 AI데이터새싹 엔지니어 부트캠프 2일차
- ai 새싹 부트캠프 4일차
- ㅂ.
- Til
- 데이터관련면접
- T
- ASAC
- 새싹 AI데이터새싹 엔지니어 부트캠프 3일차
- 새싹 AI데이터새싹 엔지니어 부트캠프
- 통계용어 정리
- 데이터분석가
- 데이터분석가면접준비
- 취준생
- Today
- Total
데이터 공부기록
1. figures & AX 본문
0. plt.figure()
우리가 matplotib으로 그래프를 그리기 위해서는 그리기 위한 도화지가 필요하다.
figure는 그 그래프들이 그려지는 큰 도화지이고, figure 함수는 그 도화지를 만들어주는 함수이다.
figsize 인자를 통해 도화지의 크기를 설정해주고, facecolor 인자(argument)를 통해 도화지의 색을 지정해줄 수 있다.
* 먼저, figure 그리기 전에 matplot을 불러옵니다.
import matplotlib.pyplot as plt
ㄱ. linen의 color로 7,7사이즈,axes(축)이 포함된 figure를 만들기
fig = plt.figure(figsize=(7,7),
                 facecolor='linen')
ax = fig.add_subplot()
출력결과

ㄴ. suptitle로 Title 만들고 fontsize로 글자 크기, fontfamily(=글꼴)로 글꼴 설정
import matplotlib.pyplot as plt
import numpy as np

figsize = (7,7)
fig, ax = plt.subplots(figsize=figsize)
fig.suptitle("Title of a Figure")


fig.suptitle("Title of a Figure",fontsize=30)

fig.suptitle("Title of a Figure",fontsize=30, fontfamily='monospace'
1. AX
Axis 는 하나의 축을 의미하며 (Ex- X axis, y axis), Axes는 x,y축이 존재하는 그래프가 그려지는 공간이다.
- Y Axis: y축
- Axes : 그래프가 그려지는 공간 (x축 과 y축) , Figure의 subplot이 Axes이다. 한개의 Figure에 여러개의 Axes가 올수 있다. * subplot은 그래프이다. Axes와의 혼동에 주의하자
ㄱ. Ax에 이름 붙이기 , figure과 동일
figsize = (7,7)
fig, ax = plt.subplots(figsize=figsize)
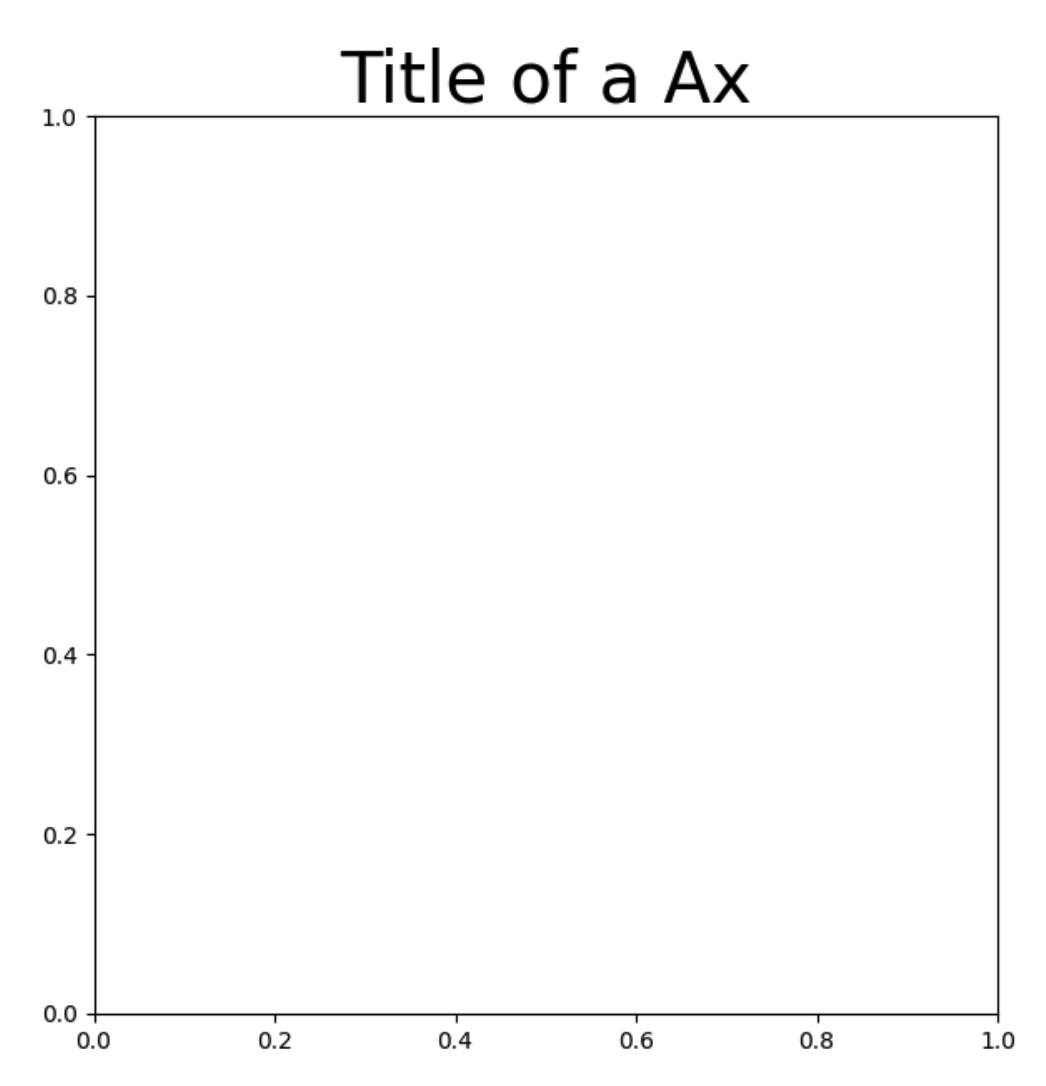
ax.set_title("Title of a Ax")
ax.set_title("Title of a Ax",
fontsize=30)
ax.set_title("Title of a Ax",
fontsize=30,
fontfmaily='monospace')
출력결과

ㄴ. Ax의 x축과 y축에 동시에 이름 붙이기
import matplotlib.pyplot as plt
figsize = (7,7)
fig, ax = plt.subplots(figsize=figsize)
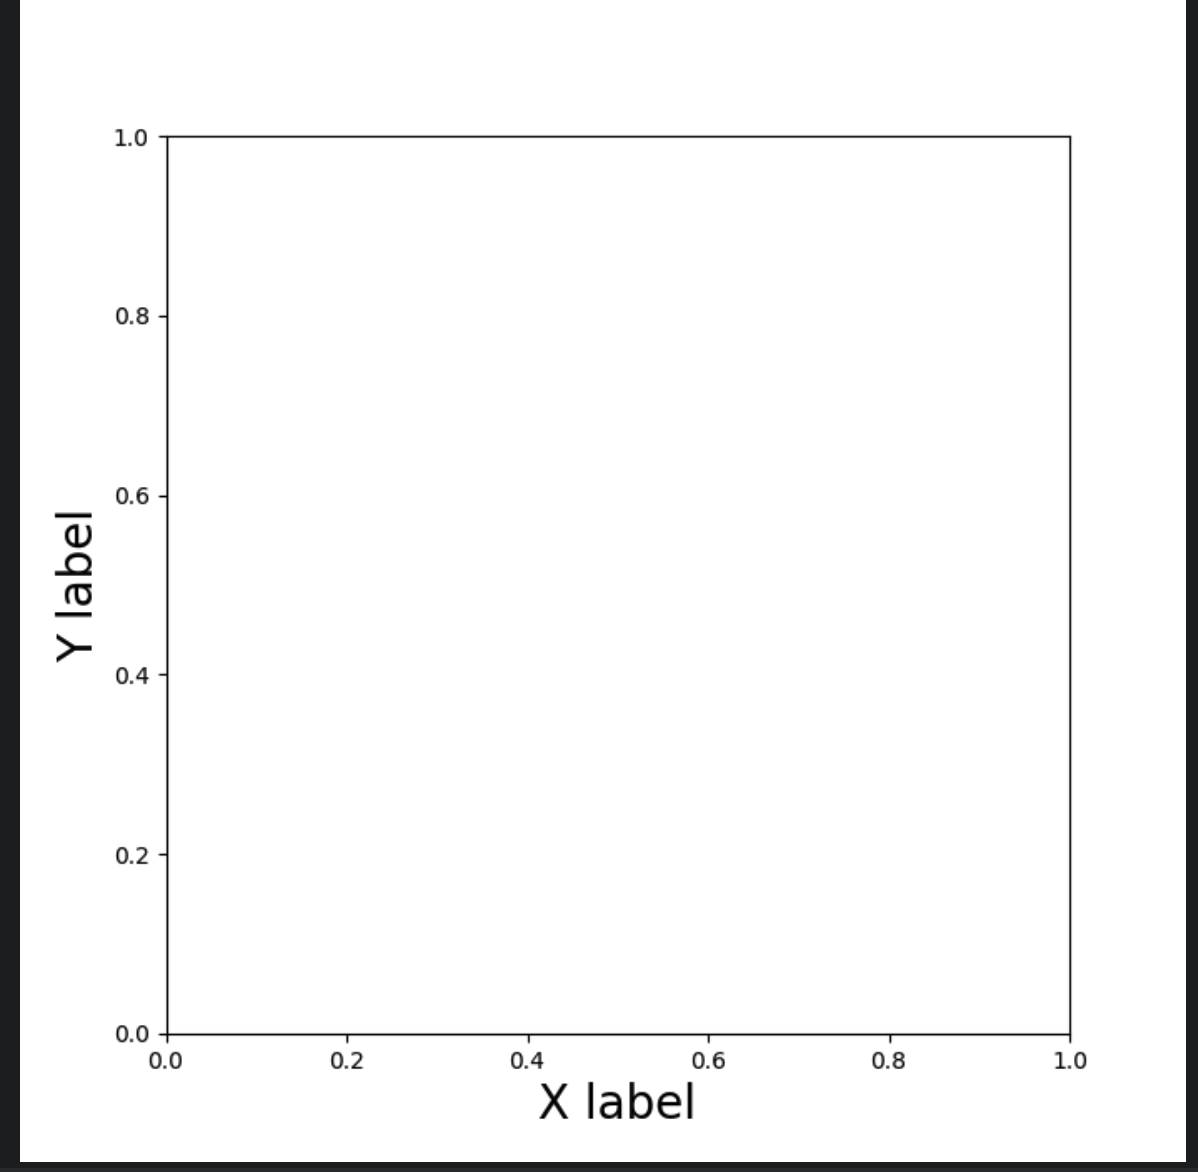
ax.set_xlabel("X label",
fontsize=20)
ax.set_ylabel("Y label",
fontsize=20)
출력결과
ㄴ. Ax의 x축과 y축의 이름을 인자(argument)로 받아 동시에 이름 붙이기
- 인자(argument)는 정의된 함수를 호출할 떄 매개변수의 값(Value)으로 넘겨주는 실제 값을 의미한다.
참고. arguments
https://velog.io/@mincheolk/Python-%EB%8B%A4%EC%96%91%ED%95%9C-arguments
[Python] 다양한 arguments
무엇이 parameter 이고 무엇이 argument 일까parameter : 매개변수 argument : 인자매개변수는 함수를 정의하는 경우에 필요한 변수(variable) 를 의미한다. 인자는 정의된 함수를 불를 때 매개변수의 값(value)
velog.io
import matplotlib.pyplot as plt

figsize = (7,7)
fig, ax = plt.subplots(figsize=figsize)

ax.set_xlabel("X label",
              fontsize=20,
              color='darkblue',
              alpha = 0.7)
ax.set_ylabel("Y label",
              fontsize=20,
              color='darkblue',
              alpha = 0.7)

# subtitle까지
figsize = (7,7)
fig, ax = plt.subplots(figsize=figsize)

fig.suptitle("Title of Figure",
              fontsize=30,
              color='darkblue',
              alpha=0.9)
ax.set_xlabel("X label",
              fontsize=20,
              color='darkblue',
              alpha=0.7)
ax.set_ylabel("Y label",
              fontsize=20,
              color='darkblue',
              alpha=0.7)
결과값


'sesac ai 과정 > matplotlib' 카테고리의 다른 글
| [Matplotlib] ax.tick_params - 눈금설정 (0) | 2023.10.23 |
|---|---|
| [Matplotlib] 기능모음 (0) | 2023.10.23 |
| [Matplotlib]Figure - 개발 문서 (0) | 2023.10.23 |
| [matplotlib]SCATTER (0) | 2023.10.05 |
| 0. Matplotlib 용어 정리 (0) | 2023.10.04 |

